
Exploring the causal relationship between dietary macronutrients and neurodegenerative diseases: a bi-directional two-sample Mendelian randomization study

 , ...
, ... Abstract
Aim: The associations between dietary macronutrient intake and neurodegenerative diseases (NDDs) have been widely reported; however, the causal effect remains unclear. The current study aimed to estimate the causal relationship between dietary macronutrient intake (i.e., carbohydrate, fat, and protein) and NDDs [e.g., Alzheimer’s disease (AD), Parkinson’s disease (PD), and amyotrophic lateral sclerosis (ALS)].
Methods: Mendelian randomization (MR) was applied to evaluate the causal relationship between dietary macronutrient intake and NDDs. We used the single-nucleotide polymorphisms strongly associated (P < 5 × 10⁻⁸) with the exposures from the genome-wide association studies as instrumental variables. Inverse-variance weighted, MR-Egger, weighted median, and the MR pleiotropy residual sum and outlier were used to verify the MR assumptions.
Results: Genetically predicted higher carbohydrate intake was associated with an increased risk of ALS [odds ratio (OR), 2.741, 95% confidence interval (CI): 1.419-5.293, P = 0.003). Vulnerability to PD was negatively associated with the relative intake of fat (OR, 0.976, 95%CI: 0.959-0.994, P = 0.012) and protein (OR, 0.987, 95%CI: 0.975-1.000, P = 0.042). The study also identified the causal influence of AD on dietary carbohydrate intake (OR, 1.022, 95%CI: 1.011-1.034, P = 0.001).
Conclusion: We found solid evidence supporting the idea that a higher carbohydrate proportion causally increases ALS risk. Genetically predicted higher AD risk is causally associated with increased dietary carbohydrate intake. Vulnerability to PD may have a causal relationship with a decrease in the dietary intake of protein and fat.
Keywords
INTRODUCTION
Neurodegenerative diseases (NDDs), such as Alzheimer’s disease (AD), Parkinson’s disease (PD), and amyotrophic lateral sclerosis (ALS), have become one of the disease categories with the largest increase in regard to the global health burden in aging populations[1,2]. Regarding the most common NDDs, approximately 46.8 million people worldwide are estimated to be living with AD, and by 2030, it is estimated that approximately 74.7 million people might suffer from this disease[2]. Furthermore, the global prevalence rates of PD and ALS were 3 per 1000 population and 4.42 per 100,000 population, respectively[3,4]. In the absence of practical therapeutic approaches for NDDs, identifying causal risk factors can lead to progress in the prevention and treatment of these diseases.
In previous studies, metabolic health has been reported to be closely associated with the prevalence of NDDs[5,6]. For example, glucose metabolism dysregulation has been considered a critical regulatory element for the progression of NDDs[7-9]. The primary sources of energy intake are carbohydrates, fat, and protein, and an individual’s metabolism of these energy sources is one of the major determinants of the development of NDD risk factors, including diabetes, cardiovascular disease, hypertension, and obesity[10-12]. Appropriate diet composition plays a vital role in reducing these risk factors, thereby reducing the risk of developing NDDs. Hence, further research is needed to clarify the effects of the relative intake of macronutrients (i.e., carbohydrate, fat, and protein) on the risk of NDDs. Unfortunately, high cost and difficulty often hinder the conduct of clinical trials on the effects of macronutrient composition[13]. Additionally, confounding commonly occurs in observational studies, and it is inevitable for macronutrient intake to be influenced by bias[13].
In the absence of high-quality randomized controlled trials, Mendelian randomization (MR) can be considered an alternative approach to assessing the causal relationship between dietary macronutrient intake and NDDs[14]. MR is a novel technique that involves using genetic data to assess and estimate the causal effects of modifiable (nongenetic) risk factors based on observational data[15]. This method depends on the use of genetic variants that are randomly allocated during meiosis, and thus it can decrease susceptibility to measurement errors and largely overcome the limitations of reverse causation and residual confounding[16]. MR analysis has recently been used to explore the causal association between dietary micronutrients (i.e., mineral nutrition) and the risk of NDDs[17]. However, there is no MR study thus far related to dietary macronutrients, including carbohydrate, fat, and protein, or their proportions in one’s diet.
The genome-wide association study (GWAS) is used to identify genomic variants that are statistically associated with a specific disease or trait. Single-nucleotide polymorphisms (SNPs), which occur more frequently in people with a certain disease or trait than in people without it, are regarded to be associated with the disease/trait. GWASs may report the association of each SNP with the outcome and provide an estimate of the causal effects on the outcome. In MR analysis, SNPs are considered instrumental variables (IV) to assess causal relationships between exposures (risk factors) and outcomes (diseases). These SNPs are used to calculate the “overall” causal effect of exposure on the risk of diseases[18].
Based on the reviewed literature, we hypothesized that gene-related differences in dietary macronutrient intake would increase susceptibility to NDDs. To test this hypothesis, we conducted a univariable bidirectional two-sample MR study based on publicly available GWAS summary data of dietary macronutrient composition (i.e., carbohydrate, fat, and protein)[19] and NDDs (i.e., AD, PD, and ALS)[20-22].
METHODS
In the present study, we performed a univariable bidirectional two-sample MR analysis to estimate the causal association between three dietary macronutrients (i.e., carbohydrate, fat, and protein) and NDDs (i.e., AD, PD, and ALS). A flowchart of the MR analysis is presented in Figure 1.
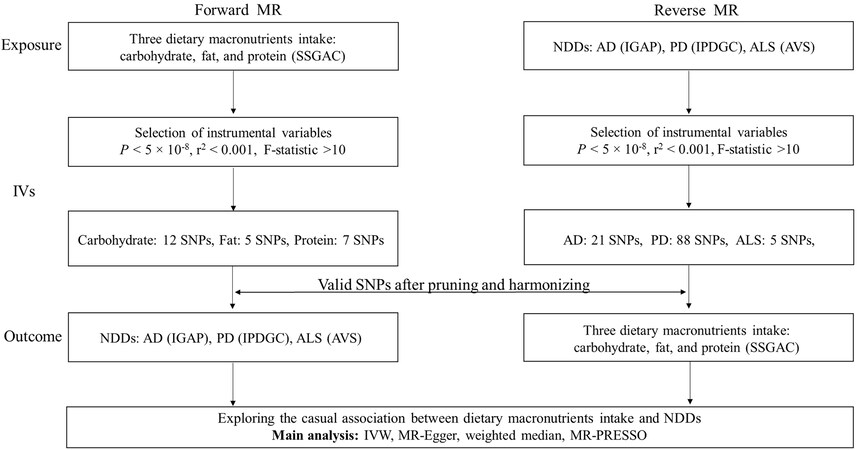
Figure 1. Flowchart of our bidirectional two-sample Mendelian randomization analysis. AD: Alzheimer’s disease; ALS: amyotrophic lateral sclerosis; AVS: ALS Variant Server; IGAP: the International Genomics of Alzheimer’s Project; IPDGC: International Parkinson’s Disease Genomics Consortium; IVW: inverse-variance weighted; MR-PRESSO: Pleiotropy Residual Sum and Outlier; PD: Parkinson’s disease; SNP: single nucleotide polymorphism; SSGAC: Social Science Genetic Association.
Data source
GWAS of dietary macronutrients
We collected summarized GWAS data on dietary macronutrients from the most recently published available studies (release from January 2021). The dietary macronutrient data used in our MR analysis were originally from the Social Science Genetic Association and included 268,922 participants aged 27-71 years. The subjects included in the dataset above were mainly of European ancestry. The data were based on self-report questionnaires containing questions on more than 70 food items in all cohorts. The self-report questionnaires were used to estimate the composition of the three macronutrients, i.e., the proportion of carbohydrate, fat, and protein to the total calories. Summary genetic association estimates were adjusted for educational attainment, the total number of dietary intake measurements, sex and birth year. Full details are provided elsewhere[19].
GWAS of AD, PD and ALS
The analysis used the genetic variants from the International Genomics of Alzheimer’s Project (IGAP), including 21,982 AD cases and 41,944 controls[20]; the International Amyotrophic Lateral Sclerosis Genomics Consortium (20,806 ALS cases and 59,804 controls)[22]; and the International Parkinson’s Disease Genomics Consortium (33,674 PD cases and 449,056 controls)[21] released on March 2019, March 2018, and December 2019, respectively. For AD GWAS summary data, clinically/neuro-pathologically defined AD might have a more robust/stronger genetic signal. In addition, PD and ALS GWASs were all from the largest Genomics Consortium. The individuals included in the datasets were of European ancestry. Principle covariates, such as age and sex, were adjusted in the association tests in all sources.
Statistical analysis
Selection of instruments
First, we selected the SNPs that reached the genome-wide significance threshold (P < 5 × 10⁻⁸) as instrumental variables (IVs) in this analysis[23,24]. Next, we excluded SNPs that were in linkage disequilibrium (r2 threshold < 0.001 within a 10 Mb window) and extracted the retained SNPs from the outcome datasets[25]. Finally, we harmonized the exposure and outcome SNPs. We also calculated the F statistics to ensure the strength of the exposures, and an F statistic > 10 was considered robust enough against weak instrument bias[26,27]. The R2 and F statistics of each SNP were calculated according to the formulas R2 = 2 × EAF × (1-EAF) × β2 and F statistics = R2 × (N-2)/(1-R2). Then, we summed them to estimate the overall R2 and F statistics[28,29] [Table 1].
The R2 and F-statistics for the genetic instruments and the power for MR
| Exposure | Outcome | nSNP | R2 | F-statistic | Power | ||
| Trait | Sample size | Trait | Sample size | ||||
| The forward MR analysis | |||||||
| Carbohydrate intake (%) | 268,922 | AD | 63,926 | 9 | 0.0013 | 359.73 | 59.2% |
| Fat intake (%) | 268,922 | AD | 63,926 | 5 | 0.0018 | 478.11 | 63.9% |
| Protein intake (%) | 268,922 | AD | 63,926 | 7 | 0.0015 | 411.24 | 62.7% |
| Carbohydrate intake (%) | 268,922 | PD | 1,456,300 | 12 | 0.0018 | 484.34 | 100% |
| Fat intake (%) | 268,922 | PD | 1,456,300 | 5 | 0.0018 | 478.11 | 100% |
| Protein intake (%) | 268,922 | PD | 1,456,300 | 7 | 0.0015 | 411.24 | 100% |
| Carbohydrate intake (%) | 268,922 | ALS | 80,610 | 11 | 0.0016 | 441.80 | 83.2% |
| Fat intake (%) | 268,922 | ALS | 80,610 | 5 | 0.0018 | 478.11 | 65.6% |
| Protein intake (%) | 268,922 | ALS | 80,610 | 7 | 0.0015 | 411.24 | 51.1% |
| The reverse MR analysis | |||||||
| AD | 63,926 | Carbohydrate intake (%) | 268,922 | 18 | 0.2424 | 16071.68 | 100% |
| AD | 63,926 | Fat intake (%) | 268,922 | 17 | 0.2339 | 15524.88 | 100% |
| AD | 63,926 | Protein intake (%) | 268,922 | 18 | 0.2424 | 16071.68 | 100% |
| PD | 1,456,300 | Carbohydrate intake (%) | 268,922 | 85 | 0.3085 | 445039.20 | 100% |
| PD | 1,456,300 | Fat intake (%) | 268,922 | 85 | 0.3085 | 445039.20 | 100% |
| PD | 1,456,300 | Protein intake (%) | 268,922 | 85 | 0.3085 | 445039.20 | 100% |
| ALS | 80,610 | Carbohydrate intake (%) | 268,922 | 5 | 0.0323 | 2578.97 | 100% |
| ALS | 80,610 | Fat intake (%) | 268,922 | 5 | 0.0323 | 2578.97 | 100% |
| ALS | 80,610 | Protein intake (%) | 268,922 | 5 | 0.0323 | 2578.97 | 100% |
MR analyses
Data were analyzed between January and April 2022. The inverse-variance weighted (IVW) method was used as the primary analysis approach to assess possible causal effects[30]. Then, we used three alternative methods of two-sample MR [i.e., MR-Egger, weighted median (WM), and the MR pleiotropy residual sum and outlier (MR-PRESSO)] to address variant heterogeneity and pleiotropy effects. The IVW method would be considered the best causal estimation if none of the instruments were found to have substantial heterogeneity or horizontal pleiotropy[31]. The MR-Egger regression and MR-PRESSO global test were used as the main estimation to account for potential pleiotropy[32]. The WM approach was regarded as valid when there was large heterogeneity across all SNPs without horizontal pleiotropy[33]. The MR-PRESSO method provides a correction test by detecting and removing potentially pleiotropic outliers[34]. A predefined decision tree to select methods could yield the best result and was adapted from[35] [Figure 2B]. Cochran’s Q statistic evaluated heterogeneity across genetic variants. A Cochran’s Q-derived P < 0.05 was considered to indicate heterogeneity[36]. The MR-Egger intercept test, as well as the MR-PRESSO global test, was also conducted, and a P value < 0.05 indicated that the IVW results might be invalid due to horizontal pleiotropy[32]. An overview of the MR design is presented in Figure 2.
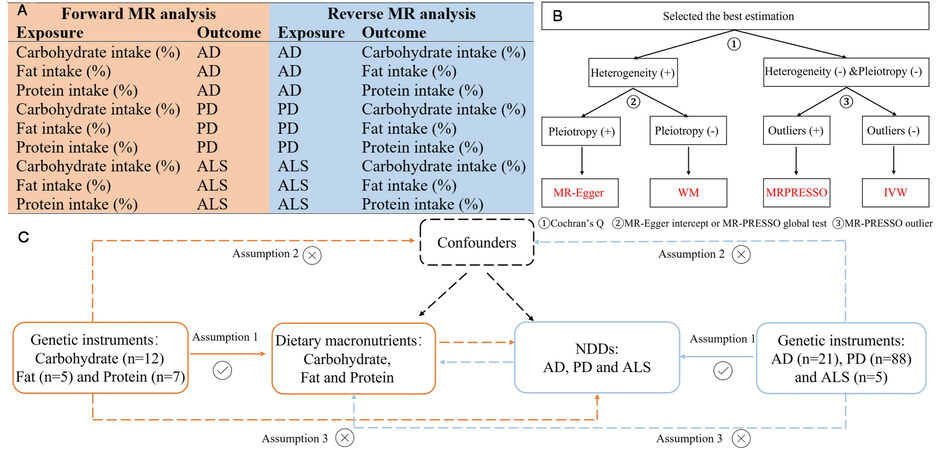
Figure 2. Overview of the design of the present study. (A) We conducted the forward and reverse MR study to explore the bi-directional relationship between dietary macronutrient intake (%) and NDDs. (B) Predefined decision tree for the selection of methods. (C) Sketch of the study design. Assumption 1: the genetic variants are supposed to be strongly associated with the risk of interest; Assumption 2: the genetic variants should not be associated with any confounding factors; and Assumption 3: the genetic variants should affect the risk of the outcome only mediated by the exposures. ALS: Amyotrophic lateral sclerosis; IVW: inverse-variance weighted; WM: weighted median; MR-PRESSO: Pleiotropy Residual Sum and Outlier.
The MR results were expressed as odds ratios (ORs) with 95% confidence intervals (CIs) interpreted as the estimated effect of a 1-SD change in dietary macronutrients on NDD risk (or the preference of dietary macronutrients per SD increase in log odds of NDDs). All statistical analyses were performed using Rstudio (R version 4.1.1) with the packages “TwoSampleMR” and “MR-PRESSO”[37]. Power calculation was performed using the online power calculator (mRnd)[38] (https://cnsgenomics.com/shiny/mRnd/).
RESULTS
Details of the SNPs used as IVs are presented in Supplementary Tables 1-6. The causal effect estimates of the IVW, MR-Egger, WM, and MR-PRESSO are available in Figures 3 and 4 and in Tables 2 and 3.
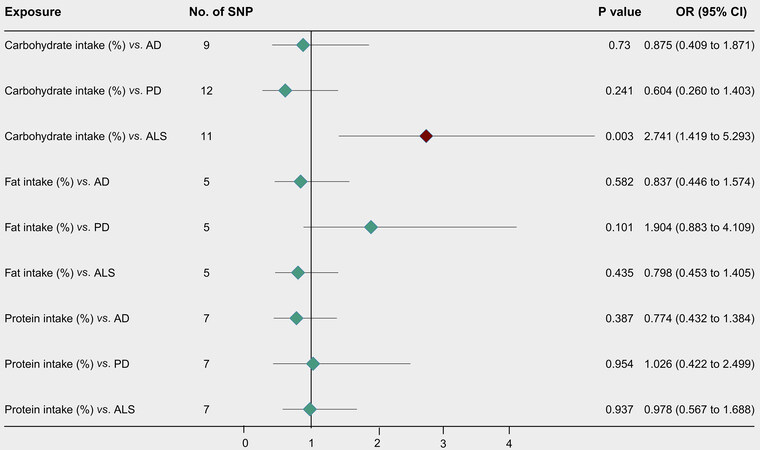
Figure 3. Forward MR analysis estimates of dietary macronutrient intake (%) and NDDs. NDDs: Neurodegenerative diseases; AD: Alzheimer’s disease; PD: Parkinson’s disease; ALS: amyotrophic lateral sclerosis; CI: confidence interval; OR: odds ratio; SNP: single-nucleotide polymorphism.
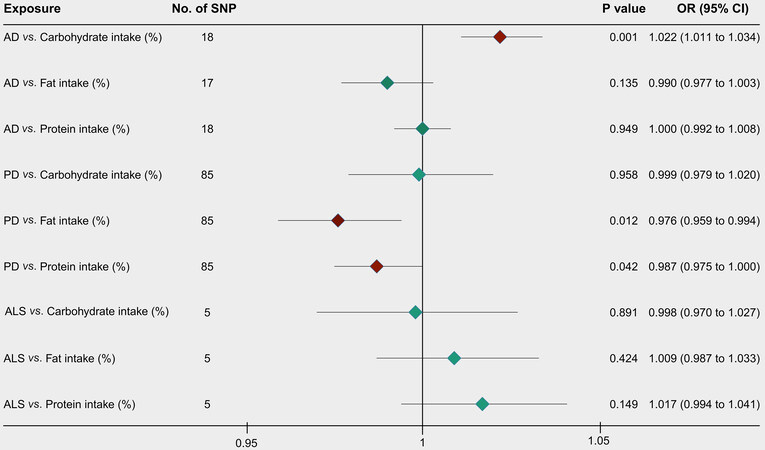
Figure 4. Reverse MR analysis estimates of dietary macronutrient intake (%) and NDDs. NDDs: Neurodegenerative diseases; AD: Alzheimer’s disease; PD: Parkinson’s disease; ALS: amyotrophic lateral sclerosis; CI: confidence interval; OR: odds ratio; SNP: single-nucleotide polymorphism.
Forward causal relations of the dietary macronutrient composition with NDDs performed by MR
| Exposure | nSNPs | Method | OR (95%CI) | P | Q pval | Intercept pval | Global P |
| Carbohydrate intake (%) vs. AD | 9 | IVW | 0.875 (0.409, 1.871) | 0.730 | 0.067 | ||
| MR Egger | 6.536 (0.019, 2259.250) | 0.549 | 0.518 | ||||
| MR-PRESSO | 0.958 (0.499, 1.836) | 0.899 | 0.108 | ||||
| WM | 1.029 (0.462, 2.293) | 0.944 | |||||
| Simple mode | 0.989 (0.278, 3.522) | 0.987 | |||||
| Weighted mode | 1.104 (0.328, 3.710) | 0.877 | |||||
| Carbohydrate intake (%) vs. PD | 12 | IVW | 0.558 (0.146, 2.134) | 0.394 | 7.33E-07 | ||
| MR Egger | 0.009 (1.36E-06, 65.922) | 0.326 | 0.382 | ||||
| MR-PRESSO | 0.558 (0.146, 2.134) | 0.412 | 0.31 | ||||
| WM | 0.604 (0.260, 1.403) | 0.241 | |||||
| Simple mode | 0.569 (0.168, 1.931) | 0.385 | |||||
| Weighted mode | 0.588 (0.206, 1.681) | 0.343 | |||||
| Carbohydrate intake (%) vs. ALS | 11 | IVW | 2.016 (1.138, 3.570) | 0.016 | 0.016 | ||
| MR Egger | 8.835 (0.855, 20.823) | 0.094 | 0.168 | ||||
| MR-PRESSO | 1.974 (1.170, 3.333) | 0.027 | 0.241 | ||||
| WM | 2.741 (1.419, 5.293) | 0.003 | |||||
| Simple mode | 3.378 (1.160, 9.842) | 0.049 | |||||
| Weighted mode | 3.344 (1.174, 9.527) | 0.047 | |||||
| Fat intake (%) vs. AD | 5 | IVW | 0.837 (0.446, 1.574) | 0.582 | 0.152 | ||
| MR Egger | 1.267 (0.393, 4.083) | 0.718 | 0.464 | ||||
| MR-PRESSO | 0.837 (0.446, 1.574) | 0.611 | 0.255 | ||||
| WM | 1.042 (0.552, 1.966) | 0.900 | |||||
| Simple mode | 1.322 (0.500, 3.495) | 0.604 | |||||
| Weighted mode | 1.245 (0.637, 2.431) | 0.557 | |||||
| Fat intake (%) vs. PD | 5 | IVW | 1.904 (0.883, 4.109) | 0.101 | 0.194 | ||
| MR Egger | 2.601 (0.561, 12.055) | 0.309 | 0.664 | ||||
| MR-PRESSO | 1.904 (0.883, 4.109) | 0.176 | 0.339 | ||||
| WM | 2.251 (1.059, 4.785) | 0.035 | |||||
| Simple mode | 2.153 (0.811, 5.718) | 0.199 | |||||
| Weighted mode | 2.190 (1.040, 4.614) | 0.108 | |||||
| Fat intake (%) vs. ALS | 5 | IVW | 0.798 (0.453, 1.405) | 0.435 | 0.205 | ||
| MR Egger | 1.142 (0.390, 3.344) | 0.824 | 0.489 | ||||
| MR-PRESSO | 0.798 (0.453, 1.405) | 0.478 | 0.289 | ||||
| WM | 0.913 (0.500, 1.666) | 0.766 | |||||
| Simple mode | 1.042 (0.423, 2.565) | 0.933 | |||||
| Weighted mode | 1.013 (0.511, 2.010) | 0.972 | |||||
| Protein intake (%) vs. AD | 7 | IVW | 0.774 (0.432, 1.384) | 0.387 | 0.295 | ||
| MR Egger | 0.459 (0.033, 6.303) | 0.585 | 0.704 | ||||
| MR-PRESSO | 0.774 (0.432, 1.384) | 0.420 | 0.304 | ||||
| WM | 0.594 (0.288, 1.226) | 0.159 | |||||
| Simple mode | 0.627 (0.182, 2.158) | 0.487 | |||||
| Weighted mode | 0.566 (0.213, 1.499) | 0.296 | |||||
| Protein intake (%) vs. PD | 7 | IVW | 0.617 (0.174, 2.182) | 0.454 | 0.002 | ||
| MR Egger | 5.336 (0.024, 1202.346) | 0.571 | 0.458 | ||||
| MR-PRESSO | 0.617 (0.174, 2.182) | 0.482 | 0.071 | ||||
| WM | 1.026 (0.422, 2.499) | 0.954 | |||||
| Simple mode | 1.012 (0.257, 3.984) | 0.987 | |||||
| Weighted mode | 1.247 (0.432, 3.596) | 0.697 | |||||
| Protein intake (%) vs. ALS | 7 | IVW | 0.978 (0.567, 1.688) | 0.937 | 0.303 | ||
| MR Egger | 6.186 (0.760, 50.366) | 0.149 | 0.136 | ||||
| MR-PRESSO | 0.978 (0.567, 1.688) | 0.940 | 0.36 | ||||
| WM | 1.380 (0.717, 2.655) | 0.335 | |||||
| Simple mode | 1.365 (0.480, 3.882) | 0.581 | |||||
| Weighted mode | 1.459 (0.611, 3.487) | 0.428 |
Reverse causal relations of NDDs with the dietary macronutrient composition performed by MR
| Exposure | nSNPs | Method | OR (95%CI) | P | Q pval | Intercept pval | Global P |
| AD vs. Carbohydrate intake (%) | 18 | IVW | 1.012 (1.004, 1.020) | 0.003 | 0.608 | ||
| MR Egger | 1.022 (1.011, 1.034) | 0.001 | 0.017 | ||||
| MR-PRESSO | 1.010 (1.002, 1.018) | 0.026 | 0.342 | ||||
| WM | 1.012 (1.001, 1.023) | 0.040 | |||||
| Simple mode | 1.010 (0.991, 1.030) | 0.329 | |||||
| Weighted mode | 1.011 (0.999, 1.024) | 0.091 | |||||
| AD vs. Fat intake (%) | 17 | IVW | 0.983 (0.973, 0.994) | 0.003 | 0.018 | ||
| MR Egger | 0.974 (0.960, 0.987) | 0.002 | 0.063 | ||||
| MR-PRESSO | 0.985 (0.975, 0.996) | 0.012 | 0.146 | ||||
| WM | 0.990 (0.977, 1.003) | 0.135 | |||||
| Simple mode | 0.997 (0.971, 1.023) | 0.819 | |||||
| Weighted mode | 0.993 (0.977, 1.010) | 0.435 | |||||
| AD vs. Protein intake (%) | 18 | IVW | 1.000 (0.992, 1.008) | 0.949 | 0.451 | ||
| MR Egger | 1.003 (0.992, 1.014) | 0.641 | 0.468 | ||||
| MR-PRESSO | 1.000 (0.991, 1.008) | 0.964 | 0.223 | ||||
| WM | 1.004 (0.993, 1.016) | 0.445 | |||||
| Simple mode | 1.006 (0.988, 1.024) | 0.526 | |||||
| Weighted mode | 1.004 (0.993, 1.015) | 0.528 | |||||
| PD vs. Carbohydrate intake (%) | 85 | IVW | 0.993 (0.984, 1.003) | 0.155 | 1.05E-05 | ||
| MR Egger | 0.999 (0.979, 1.020) | 0.958 | 0.499 | ||||
| MR-PRESSO | 0.994 (0.985, 1.004) | 0.261 | < 0.001 | ||||
| Outlier-corrected | 0.997 (0.988, 1.007) | 0.607 | |||||
| WM | 1.001 (0.987, 1.014) | 0.936 | |||||
| Simple mode | 0.992 (0.968, 1.017) | 0.546 | |||||
| Weighted mode | 1.004 (0.987, 1.021) | 0.643 | |||||
| PD vs. Fat intake (%) | 85 | IVW | 0.996 (0.987, 1.004) | 0.309 | 0.004 | ||
| MR Egger | 0.976 (0.959, 0.994) | 0.012 | 0.021 | ||||
| MR-PRESSO | 0.995 (0.986, 1.003) | 0.238 | 0.002 | ||||
| Outlier-corrected | 0.996 (0.988, 1.005) | 0.411 | |||||
| WM | 0.992 (0.980, 1.005) | 0.220 | |||||
| Simple mode | 1.015 (0.979, 1.052) | 0.433 | |||||
| Weighted mode | 0.976 (0.955, 0.997) | 0.033 | |||||
| PD vs. Protein intake (%) | 85 | IVW | 0.991 (0.982, 1.000) | 0.050 | 3.08E-04 | ||
| MR Egger | 0.997 (0.978, 1.017) | 0.779 | 0.486 | ||||
| MR-PRESSO | 0.992 (0.982, 1.001) | 0.072 | 0.067 | ||||
| WM | 0.987 (0.975, 1.000) | 0.042 | |||||
| Simple mode | 0.989 (0.966, 1.015) | 0.425 | |||||
| Weighted mode | 0.987 (0.972, 1.002) | 0.091 | |||||
| ALS vs. Carbohydrate intake (%) | 5 | IVW | 0.998 (0.970, 1.027) | 0.891 | 0.199 | ||
| MR Egger | 0.994 (0.916, 1.079) | 0.903 | 0.931 | ||||
| MR-PRESSO | 0.998 (0.970, 1.027) | 0.897 | 0.294 | ||||
| WM | 1.010 (0.981, 1.040) | 0.492 | |||||
| Simple mode | 1.015 (0.970, 1.062) | 0.565 | |||||
| Weighted mode | 1.014 (0.978, 1.050) | 0.497 | |||||
| ALS vs. Fat intake (%) | 5 | IVW | 1.009 (0.987, 1.033) | 0.424 | 0.603 | ||
| MR Egger | 1.043 (0.985, 1.106) | 0.247 | 0.311 | ||||
| MR-PRESSO | 1.009 (0.990, 1.029) | 0.388 | 0.636 | ||||
| WM | 1.012 (0.984, 1.040) | 0.417 | |||||
| Simple mode | 1.023 (0.981, 1.066) | 0.348 | |||||
| Weighted mode | 1.016 (0.980, 1.053) | 0.444 | |||||
| ALS vs. Protein intake (%) | 5 | IVW | 1.017 (0.994, 1.041) | 0.149 | 0.814 | ||
| MR Egger | 1.016 (0.959, 1.077) | 0.621 | 0.982 | ||||
| MR-PRESSO | 1.017 (1.002, 1.032) | 0.083 | 0.833 | ||||
| WM | 1.019 (0.991, 1.047) | 0.184 | |||||
| Simple mode | 1.027 (0.989, 1.066) | 0.243 | |||||
| Weighted mode | 1.019 (0.985, 1.053) | 0.339 |
The causal effect of carbohydrate intake on NDDs
Considering the best causal estimation, ALS showed evidence of being influenced by carbohydrate intake. The effect estimate of carbohydrate intake on ALS risk was indicated by OR = 2.741 (95%CI: 1.419-5.293,
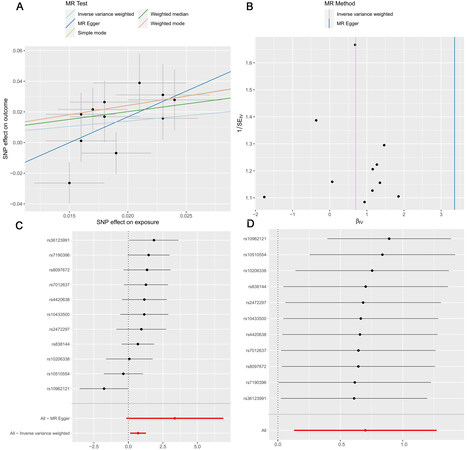
Figure 5. Scatter plot (A), funnel plot (B), forest plot (C) and leave-one-out plot (D) of the causal effect of dietary carbohydrate intake on ALS risk. ALS: Amyotrophic lateral sclerosis; SNP: single-nucleotide polymorphism.
The causal effect of fat intake on NDDs
The causal effect estimates in the IVW method were OR = 0.837 (95%CI: 0.446-1.574, P = 0.582), 1.904 (95%CI: 0.883-4.109, P = 0.101), and 0.798 (95%CI: 0.453-1.405, P = 0.435) for AD, PD, and ALS, respectively. No directional pleiotropy or heterogeneity was detected by the MR Egger intercept test and Cochran’s Q statistic. The MR-PRESSO global test also showed no evidence that suggested horizontal pleiotropy (PAD= 0.255, PPD= 0.339, and PALS= 0.289).
The causal effect of protein intake on NDDs
All models consistently suggested that genetically predicted protein intake failed to be associated with the three disorders (AD: OR, 0.774, 95%CI: 0.432-1.384, P = 0.387, IVW; PD: OR, 1.026, 95%CI: 0.422-2.499, P = 0.954, WM; ALS: OR, 0.978, 95%CI: 0.567-1.688, P = 0.937, IVW). Cochran’s Q test for protein intake on PD risk revealed substantial heterogeneity across SNPs (P = 0.002). The MR-Egger intercept test and MR-PRESSO global test indicated no remarkable horizontal pleiotropy for protein intake of NDDs.
The causal effect of AD on dietary macronutrient intake
The effect estimates for AD and dietary macronutrients were OR = 1.022 (95%CI: 1.011-1.034, P = 0.001, MR-Egger), OR = 0.990 (95%CI: 0.977-1.003, P = 0.135, WM), and OR = 1.000 (95%CI: 0.992-1.008, P = 0.949, IVW) for dietary intake of carbohydrate, fat, and protein, respectively. There was significant heterogeneity for relative fat intake (P = 0.018). In addition, the MR Egger intercept test detected the presence of horizontal pleiotropy for relative carbohydrate intake (P = 0.017).
The causal effect of PD on dietary macronutrient intake
Genetically predicted higher PD risk was negatively associated with the dietary intake of fat (OR: 0.976, 95%CI: 0.959-0.994, P = 0.012, MR Egger) and protein (OR: 0.987, 95%CI: 0.975-1.000, P = 0.042, WM) but not with carbohydrate intake (OR: 0.999, 95%CI: 0.979-1.020, P = 0.958, MR Egger). Substantial heterogeneity was detected by Cochran’s Q test, with the P values of 1.05E-05 for carbohydrate, 0.004 for fat, and 3.08E-04 for protein. In addition, regarding the effect of PD on the dietary intake of fat, the intercept test in MR-Egger found evidence of unbalanced pleiotropy (P = 0.021). The MR-PRESSO global test also indicated strong evidence of directional horizontal pleiotropy for carbohydrate and fat intake. However, the MR-PRESSO results were nonsignificant after correcting for outliers.
The causal effect of ALS on dietary macronutrient intake
Based on the IVW method, we failed to find evidence to support a potential causal relationship between ALS and the relative dietary macronutrient intake, with ORs and 95%CIs of 0.998 (95%CI: 0.970, 1.027), 1.009 (95%CI: 0.987, 1.033), and 1.017 (95%CI: 0.994, 1.041) for carbohydrate, fat, and protein, respectively. For all these estimates, the MR-Egger intercept and MR-PRESSO global test did not indicate the pleiotropic effects of the SNPs in the MR study. Cochran’s Q tests also did not provide evidence of heterogeneity.
For SNP conformity, we conducted a leave-one-out analysis and generated forest maps. The forest map indicated stable results [Figure 5C and Supplementary Figures 1-6]. The F statistics for all the SNPs ranged from 28 to 50,488 across the forward and reverse MR analyses, and these values were higher than the conventional threshold of 10, the rule of thumb to distinguish between strong and weak instruments. The statistical power was also calculated, and the results were all higher than 50%. The R2 and F-statistics for the IVs and the power for MR are shown in Table 1.
DISCUSSION
In this work, we used MR to investigate the causal relationships between dietary macronutrient intake (carbohydrate, protein, and fat) and the most common NDDs (AD, PD, and ALS). It was shown that genetic predisposition to higher carbohydrate intake was related to the increased risk of ALS. Moreover, we found that vulnerability to PD was negatively associated with protein and fat intake. The study also found a potential causal influence of AD on dietary carbohydrate intake.
According to a previous study, high carbohydrate intake may increase the risk of ALS[39]. Regarding the prognosis of the disease, carbohydrate intake was also found to be positively related to the short-term survival of ALS[40]. ALS patients were reported to be affected by glucose metabolism abnormalities, which could be explained by the deficit of the insulin-mitochondrial axis, a glucose-metabolizing pathway[9,41-43]. On the other hand, abnormal glucose tolerance may result from muscle wasting or physical inactivity in ALS patients, leading to a decreased ability to promptly store a large glucose load[44,45]. Therefore, there might exist a vicious cycle between carbohydrate intake and ALS risk that accelerates the progression of the disease. However, two prospective studies recently reported a decreased risk of ALS in persons who were obese and overweight[46,47]. A randomized controlled trial identified the benefits of a high-carbohydrate diet on the progression of ALS via weight gain, supporting a high-carbohydrate diet as a promising nonpharmacologic intervention for ALS[48]. Additionally, studies in a mouse model of ALS have shown that a high-carbohydrate hypercaloric diet increases weight and delays disease progression[49,50]. Therefore, the causal relationship between high carbohydrate intake and the risk of ALS is still unknown. Our study implemented an MR approach with a robustly validated genetic instrument for relative carbohydrate intake and provided robust evidence to support that high carbohydrate intake might cause an increased risk of ALS. These findings may have important public health implications. Individuals affected by ALS should receive advice about avoiding a high carbohydrate diet, and such a carbohydrate restriction strategy should be included in prevention guidelines for ALS patients regarding macronutrient intake recommendations.
Unexpectedly and interestingly, our primary analysis showed that AD was causally associated with a higher carbohydrate intake, and PD was causally associated with a low intake of protein and fat. However, the underlying mechanisms explaining the associations remain unclear. A previous study reported that AD patients have a greater preference for sweet or sugary food than normal controls and concluded that craving sweet food might be one of the clinical syndromes of AD patients[51]. Decreased serotonin activity could provide a link between AD and carbohydrate preference. Previous studies have found that low brain serotonin levels are linked to impairments in episodic memory and motor speed[52]. Ingestion of carbohydrate-rich food could increase serotonin synthesis via supplementation with tryptophan, the amino acid precursor for serotonin[53]. Therefore, the preference for high-carbohydrate foods would be helpful in alleviating cognitive function decline by increasing serotonin synthesis[54]. A significant body of evidence has pointed to the central role of alpha-synuclein in the pathogenesis of PD. The enteric nervous system, in which alpha-synuclein accumulated, was considered the first vulnerable region of the central nervous system to become affected in PD[55]. The pathologic accumulation of alpha-synuclein is toxic and can interfere with the normal synaptic function of neurons in the gastrointestinal tract, which may contribute to gastrointestinal dysmotility. Food rich in protein and high-fat meats can stress the digestive system due to overwork, thereby aggravating digestive problems[56]. It is reasonable that PD patients will avoid food that is hard to digest in their daily life. Regrettably, there are few clinical trials implying the causal role of PD on protein and fat intake. Thus, further study is needed to elucidate the causal relationship.
However, our MR analyses failed to identify a causal association between dietary macronutrient intake and the risk of AD and PD. These results are inconsistent with those based on prospective studies, which tend to report a significant influence of diet composition on the two disorders[57-60]. Although these studies concluded that dietary factors played a role in the onset and progression of the two diseases, the current evidence is not adequate to support the existence of a causal relationship between them.
The main strength of the MR study is that it is the first MR study to explore the causal relationship between dietary macronutrients and NDDs, which contributes to filling the gaps left by the published observational studies and extends the related research considerably. The present study also has limitations. First, there are only five available SNPs significantly associated with fat intake and ALS, leading to convergence problems of optimization algorithms within MR methods. To address this issue, a larger population is needed. Second, information regarding the exposure of interest was all from the self-report questionnaires; thus, it is challenging to avoid measurement bias.
In this study, genetically predicted relatively high dietary carbohydrate intake was associated with an increased risk of ALS. In the other direction, genetically predicted higher AD risk is associated with increased dietary carbohydrate intake. We also provided genetic evidence supporting the causal relationship between vulnerability to PD and a decrease in the dietary intake of protein and fat. Future studies are warranted to replicate this finding and elucidate the potential underlying mechanism.
DECLARATIONS
AcknowledgmentsSummary-level data for the genetic associations with dietary macronutrients, AD, PD, ALS were obtained from GWAS respectively by Meddens et al., Kunkle et al., Nalls et al., Nicolas et al. We sincerely thank all participants for sharing the genome-wide summary statistics.
Authors’ contributionsConceptualization: Tang Y
Data curation: Zheng Y
Formal analysis: Wei T, Wang Z
Methodology: Guo Z, Li X, Hou H
Resources: Tang Y
Software: Guo Z
Writing-original draft: Wei T
Writing-review & editing: Guo Z
All authors read and approved the final manuscript.
Availability of data and materialsAll data described in the article are provided within the article.
Financial support and sponsorshipThis work was supported by Beijing Natural Science Foundation (JQ19024), the National Natural Science Foundation of China (81970996), Beijing Hospitals Authority’s Ascent Plan (DFL20220703), Beijing Municipal Science & Technology Commission (Z191100006619046).
Conflicts of interestAll authors declared that there are no conflicts of interest.
Ethical approval and consent to participateNot applicable.
Consent for publicationNot applicable.
Copyright© The Author(s) 2022.
Supplementary MaterialsREFERENCES
1. Roth GA, Abate D, Abate KH, et al. Global, regional, and national age-sex-specific mortality for 282 causes of death in 195 countries and territories, 1980-2017: a systematic analysis for the Global Burden of Disease Study 2017. The Lancet 2018;392:1736-88.
2. Bakhta K, Cecillon E, Lacombe E, Lamy M, Leboucher A, Philippe J. Alzheimer’s disease and neurodegenerative diseases in France. Lancet 2019;394:466-7.
3. Xu L, Liu T, Liu L, et al. Global variation in prevalence and incidence of amyotrophic lateral sclerosis: a systematic review and meta-analysis. J Neurol 2020;267:944-53.
4. Erkkinen MG, Kim MO, Geschwind MD. Clinical neurology and epidemiology of the major neurodegenerative diseases. Cold Spring Harb Perspect Biol 2018;10:a033118.
5. Procaccini C, Santopaolo M, Faicchia D, et al. Role of metabolism in neurodegenerative disorders. Metabolism 2016;65:1376-90.
6. Razay G, Vreugdenhil A, Wilcock G. Obesity, abdominal obesity and Alzheimer disease. Dement Geriatr Cogn Disord 2006;22:173-6.
7. Sánchez-Gómez A, Díaz Y, Duarte-Salles T, Compta Y, Martí MJ. Prediabetes, type 2 diabetes mellitus and risk of Parkinson’s disease: a population-based cohort study. Parkinsonism Relat Disord 2021;89:22-7.
8. González A, Camila C, Maccioni RB. Alzheimer’s disease: a potential diabetes type 3. Alzheimer’s & Dementia 2021:17.
9. D’Amico E, Grosso G, Nieves JW, Zanghì A, Factor-Litvak P, Mitsumoto H. Metabolic abnormalities, dietary risk factors and nutritional management in amyotrophic lateral sclerosis. Nutrients 2021;13:2273.
10. Shang X, Hill E, Zhu Z, et al. Macronutrient intake and risk of dementia in community-dwelling older adults: a nine-year follow-up cohort study. J Alzheimers Dis 2022;85:791-804.
11. Shan Z, Guo Y, Hu FB, Liu L, Qi Q. Association of low-carbohydrate and low-fat diets with mortality among US adults. JAMA Intern Med 2020;180:513-23.
12. Ebbeling CB, Young IS, Lichtenstein AH, et al. Dietary fat: friend or foe? Clin Chem 2018;64:34-41.
13. Park S, Lee S, Kim Y, et al. Causal effects of relative fat, protein, and carbohydrate intake on chronic kidney disease: a Mendelian randomization study. Am J Clin Nutr 2021;113:1023-31.
14. Sekula P, Del Greco M F, Pattaro C, Köttgen A. Mendelian randomization as an approach to assess causality using observational data. J Am Soc Nephrol 2016;27:3253-65.
15. Smith G, Hemani G. Mendelian randomization: genetic anchors for causal inference in epidemiological studies. Hum Mol Genet 2014;23:R89-98.
16. Holmes MV, Ala-Korpela M, Smith GD. Mendelian randomization in cardiometabolic disease: challenges in evaluating causality. Nat Rev Cardiol 2017;14:577-90.
17. Cheng WW, Zhu Q, Zhang HY. Mineral nutrition and the risk of chronic diseases: a mendelian randomization study. Nutrients 2019;11:378.
18. Davies NM, Holmes MV, Davey Smith G. Reading Mendelian randomisation studies: a guide, glossary, and checklist for clinicians. BMJ 2018;362:k601.
19. Meddens SFW, de Vlaming R, Bowers P, et al. 23andMe Research Team. Genomic analysis of diet composition finds novel loci and associations with health and lifestyle. Mol Psychiatry 2021;26:2056-69.
20. Kunkle BW, Grenier-Boley B, Sims R, et al. Alzheimer Disease Genetics Consortium (ADGC). Genetic meta-analysis of diagnosed Alzheimer’s disease identifies new risk loci and implicates Aβ, tau, immunity and lipid processing. Nat Genet 2019;51:414-30.
21. Nalls MA, Blauwendraat C, Vallerga CL, et al. Identification of novel risk loci, causal insights, and heritable risk for Parkinson’s disease: a meta-analysis of genome-wide association studies. The Lancet Neurology 2019;18:1091-102.
22. Nicolas A, Kenna KP, Renton AE, et al. ITALSGEN Consortium. Genome-wide analyses identify KIF5A as a novel ALS gene. Neuron 2018;97:1268-1283.e6.
23. Wang K, Ding L, Yang C, Hao X, Wang C. Exploring the relationship between psychiatric traits and the risk of mouth ulcers using bi-directional Mendelian randomization. Front Genet 2020;11:608630.
24. Huang SY, Yang YX, Zhang YR, et al. Investigating causal relations between circulating metabolites and Alzheimer’s disease: a Mendelian randomization study. J Alzheimers Dis 2022;87:463-77.
25. Chang CC, Chow CC, Tellier LC, Vattikuti S, Purcell SM, Lee JJ. Second-generation PLINK: rising to the challenge of larger and richer datasets. Gigascience 2015;4:7.
26. Lawlor DA, Harbord RM, Sterne JAC, Timpson N, Davey Smith G. Mendelian randomization: using genes as instruments for making causal inferences in epidemiology. Statist Med 2008;27:1133-63.
27. Li X, Tian Y, Yang YX, et al. Life course adiposity and Alzheimer’s disease: a Mendelian randomization study. J Alzheimers Dis 2021;82:503-12.
28. Zhang Q, Zhang X, Zhang J, et al. Causal relationship between lung function and atrial fibrillation: a two sample univariable and multivariable, bidirectional Mendelian randomization study. Front Cardiovasc Med 2021;8:769198.
29. Wei T, Guo Z, Wang Z, et al. Five major psychiatric disorders and Alzheimer’s disease: a bidirectional Mendelian randomization study. J Alzheimers Dis 2022;87:675-84.
30. Wang H, Guo Z, Zheng Y, Yu C, Hou H, Chen B. No casual relationship between T2DM and the risk of infectious diseases: a two-sample Mendelian randomization study. Front Genet 2021;12:720874.
31. Hartwig FP, Davey Smith G, Bowden J. Robust inference in summary data Mendelian randomization via the zero modal pleiotropy assumption. Int J Epidemiol 2017;46:1985-98.
32. Bowden J, Davey Smith G, Burgess S. Mendelian randomization with invalid instruments: effect estimation and bias detection through Egger regression. Int J Epidemiol 2015;44:512-25.
33. Bowden J, Davey Smith G, Haycock PC, Burgess S. Consistent estimation in Mendelian randomization with some invalid instruments using a weighted median estimator. Genet Epidemiol 2016;40:304-14.
34. Verbanck M, Chen CY, Neale B, Do R. Detection of widespread horizontal pleiotropy in causal relationships inferred from Mendelian randomization between complex traits and diseases. Nat Genet 2018;50:693-8.
35. Nazarzadeh M, Pinho-Gomes AC, Bidel Z, et al. Plasma lipids and risk of aortic valve stenosis: a Mendelian randomization study. Eur Heart J 2020;41:3913-20.
36. Ning J, Huang SY, Chen SD, Zhang YR, Huang YY, Yu JT. Investigating casual associations among gut microbiota, metabolites, and neurodegenerative diseases: a Mendelian randomization study. J Alzheimers Dis 2022;87:211-22.
37. Hemani G, Zheng J, Elsworth B, et al. The MR-base platform supports systematic causal inference across the human phenome. Elife 2018;7:e34408.
38. Brion MJ, Shakhbazov K, Visscher PM. Calculating statistical power in Mendelian randomization studies. Int J Epidemiol 2013;42:1497-501.
39. Okamoto K, Kihira T, Kondo T, et al. Nutritional status and risk of amyotrophic lateral sclerosis in Japan. Amyotroph Lateral Scler 2007;8:300-4.
40. Kim B, Jin Y, Kim SH, Park Y. Association between macronutrient intake and amyotrophic lateral sclerosis prognosis. Nutr Neurosci 2020;23:8-15.
41. Kioumourtzoglou MA, Rotem RS, Seals RM, Gredal O, Hansen J, Weisskopf MG. Diabetes mellitus, obesity, and diagnosis of amyotrophic lateral sclerosis: a population-based study. JAMA Neurol 2015;72:905-11.
42. Brito MD, da Silva GFG, Tilieri EM, Araujo BG, Calió ML, Rosenstock TR. Metabolic alteration and amyotrophic lateral sclerosis outcome: a systematic review. Front Neurol 2019;10:1205.
43. Pradat PF, Bruneteau G, Gordon PH, et al. Impaired glucose tolerance in patients with amyotrophic lateral sclerosis. Amyotroph Lateral Scler 2010;11:166-71.
44. Ferri A, Coccurello R. What is “Hyper” in the ALS hypermetabolism? Mediators Inflamm 2017;2017:7821672.
46. Gallo V, Wark PA, Jenab M, et al. Prediagnostic body fat and risk of death from amyotrophic lateral sclerosis: the EPIC cohort. Neurology 2013;80:829-38.
47. O’Reilly ÉJ, Wang H, Weisskopf MG, et al. Premorbid body mass index and risk of amyotrophic lateral sclerosis. Amyotroph Lateral Scler Frontotemporal Degener 2013;14:205-11.
48. Wills A, Hubbard J, Macklin EA, et al. Hypercaloric enteral nutrition in patients with amyotrophic lateral sclerosis: a randomised, double-blind, placebo-controlled phase 2 trial. The Lancet 2014;383:2065-72.
49. Dupuis L, Oudart H, René F, Gonzalez de Aguilar JL, Loeffler JP. Evidence for defective energy homeostasis in amyotrophic lateral sclerosis: benefit of a high-energy diet in a transgenic mouse model. Proc Natl Acad Sci U S A 2004;101:11159-64.
50. Mattson MP, Cutler RG, Camandola S. Energy intake and amyotrophic lateral sclerosis. NMM 2007;9:17-20.
51. Mungas D, Cooper JK, Weiler PG, Gietzen D, Franzi C, Bernick C. Dietary preference for sweet foods in patients with dementia. J Am Geriatr Soc 1990;38:999-1007.
52. Jenkins TA, Nguyen JC, Polglaze KE, Bertrand PP. Influence of tryptophan and serotonin on mood and cognition with a possible role of the gut-brain axis. Nutrients 2016;8:56.
53. Fernstrom JD, Wurtman RJ. Brain serotonin content: increase following ingestion of carbohydrate diet. Science 1971;174:1023-5.
54. Spring B, Chiodo J, Bowen DJ. Carbohydrates, tryptophan, and behavior: a methodological review. Psychol Bull 1987;102:234-56.
56. Zhang M, Yang XJ. Effects of a high fat diet on intestinal microbiota and gastrointestinal diseases. World J Gastroenterol 2016;22:8905-9.
57. Gao X, Chen H, Fung TT, et al. Prospective study of dietary pattern and risk of Parkinson disease. Am J Clin Nutr 2007;86:1486-94.
58. Dong J, Beard JD, Umbach DM, et al. Dietary fat intake and risk for Parkinson’s disease. Mov Disord 2014;29:1623-30.
59. Féart C, Samieri C, Rondeau V, et al. Adherence to a Mediterranean diet, cognitive decline, and risk of dementia. JAMA 2009;302:638-48.
Cite This Article
Export citation file: BibTeX | RIS
OAE Style
Wei T, Guo Z, Wang Z, Li X, Zheng Y, Hou H, Tang Y. Exploring the causal relationship between dietary macronutrients and neurodegenerative diseases: a bi-directional two-sample Mendelian randomization study. Ageing Neur Dis 2022;2:14. http://dx.doi.org/10.20517/and.2022.12
AMA Style
Wei T, Guo Z, Wang Z, Li X, Zheng Y, Hou H, Tang Y. Exploring the causal relationship between dietary macronutrients and neurodegenerative diseases: a bi-directional two-sample Mendelian randomization study. Ageing and Neurodegenerative Diseases. 2022; 2(3): 14. http://dx.doi.org/10.20517/and.2022.12
Chicago/Turabian Style
Wei, Tao, Zheng Guo, Zhibin Wang, Xingang Li, Yulu Zheng, Haifeng Hou, Yi Tang. 2022. "Exploring the causal relationship between dietary macronutrients and neurodegenerative diseases: a bi-directional two-sample Mendelian randomization study" Ageing and Neurodegenerative Diseases. 2, no.3: 14. http://dx.doi.org/10.20517/and.2022.12
ACS Style
Wei, T.; Guo Z.; Wang Z.; Li X.; Zheng Y.; Hou H.; Tang Y. Exploring the causal relationship between dietary macronutrients and neurodegenerative diseases: a bi-directional two-sample Mendelian randomization study. Ageing. Neur. Dis. 2022, 2, 14. http://dx.doi.org/10.20517/and.2022.12
About This Article
Copyright

Data & Comments
Data


 Cite This Article 33 clicks

 Like This Article 35
likes
Like This Article 35
likes


Comments
Comments must be written in English. Spam, offensive content, impersonation, and private information will not be permitted. If any comment is reported and identified as inappropriate content by OAE staff, the comment will be removed without notice. If you have any queries or need any help, please contact us at support@oaepublish.com.